

The goal of this project is to uncover new insights in the data and present our findings in an exciting and accessible way; WWP’s hope is to get young people interested in learning more about the texts in the collection. We will be visually displaying our findings in the form of several interactive and static charts that will showcase the ways in which the texts are connected to each other, along with any other trends we can extrapolate from the data. We will be placing an emphasis on texts written by women. We want to demonstrate how many of these texts are out there, along with allowing the viewer to learn more about specific texts in the collection. We hope to find correlations between works in the collection that allow people to understand them in a new way.
We are primarily working with chronological data from the WWP. The data tracks writers, texts, and intertextual gestures within those texts. The data is split up into multiple different json files for the following categories: Barbauld, classical, drama, Dryden, female writers, Horace, novels, poetry, Pope, sacred texts, and Shakespeare. Barbauld, Dryden, Horace, Pope, and Shakespeare all contain data on works that reference those authors. Classical, drama, female writers, and sacred texts contain data on works that reference texts of those categories. For our project, we plan to focus on the reference data included in each file to investigate trends of how the texts interact with each other. Specifically, we plan to look at how references to female authors have changed over time and look for other trends present in how authors reference each other. To make the data more manageable to work with, we converted the json files to csv files, detailed more below when discussing our data cleaning.
Each dataset has columns wwoDocId, wwoDocDesc, referencedWorks, totalGestures, gestureTypes, and publicationDate. WwwoDocID (ordinal) is the unique ID of each row. WwoDocDesc contains information on author (categorical), title (categorical), and publication date (quantitative) of the text. The column referencedWorks contains a list of references, each containing the id (ordinal), title (categorical), year (quantitative), and author (categorical) of the referenced work plus the amount of times it was referenced (quantitative). The way it was referenced is noted in the guestureTypes column. This column contains a list of gesture types (categorical) and the count for that type of gesture (quantitative). TotalGestures (quantitative) is the number of gestures present in the text. Finally, publicationDate (quantitative) is the publication date of the text.
To clean the data, we first converted the json files to csv files to allow us to work with the data better in python. After that, we were having trouble with the referencedWorks and gestureTypes columns, as both had a variable length list of information within them, making it hard to work with those columns. To fix this, we created new rows for each referenced work, keeping all of the other columns the same, so that the referencedWorks column only had one item per row in it. We left the gestureTypes as is for now, as the gestureTypes column does not specify which reference each gesture matches up with, so may not prove useful in our analysis of referencing.
Our visualizations will be primarily to bring new life to the texts through interesting insights and uncovering hidden trends in the data (exploratory visualizations). Our primary stakeholder will be the members of WWP, along with their blog readers and community members. Their goal is to get more “modern” readers interested in the older texts in a new way. Here are a few tasks we identified and hope to answer with our visualizations.
| Domain Task | Analytic Task | Search Task | Analyze Task |
|---|---|---|---|
| Which time period has the most female writers? | Cluster | Locate | Present |
| Is there an upward trend in male authors referencing women over the years? | Correlate | Browse | Discover |
| Are intertextual gestures in writing increasing over time? | Correlate | Browse | Discover |
| Which authors/books do women reference the most? | Retrieve Value | Locate | Discover |
Here are a few findings from our initial static charts:
Some female authors reference themselves more than they reference others. Ex: Barbauld
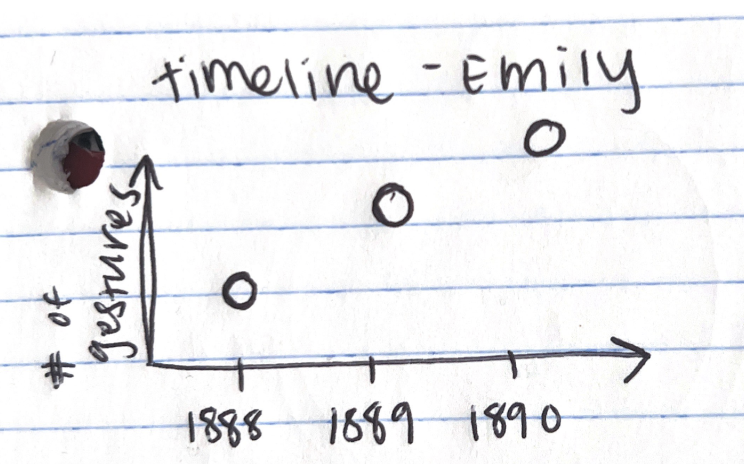
Our design process was iterative and collaborative. We started out by thinking of some charts that we thought would describe the data in a clear and effective way and created sketches with the marks and channels we wanted to use (pictured below). Some examples of charts we thought of included the scattter plots representing how female authors reference big names like Shakespeare and Dryden. We also sketched out the basics of the Sankey diagrams which we also ended up implementing. We also speculated that this chart would be interactive in that one can rearrange the nodes and group them in whatever way they like. Another one we sketched out was the line chart displaying how references to female authors have changed over time, and we also were able to successfully implement it.
Scatter Plots: How women reference other authors
The first chart is a bar graph of the count of references to popular authors. This chart is useful in seeing the overall popularity of authors. As seen in the chart, William Shakespeare and Hannah Cowley are the most referenced authors.
The second chart is a stream graph of the number of references to popular authors over time. As seen from the chart, Shakespeare was referenced a large amount throughout the early 1600s, then again some in the mid to late 1600s. In the 1700s, Anna Barbauld and Alexander Pope were the most referenced authors, and Cowley was in the 1800s.
These two charts are linked together so that clicking on an author’s data in one highlights the corresponding data in the other. Looking at these charts in parallel is interesting to see how some popular authors are referenced gradually over time, whereas others have short bursts of large amounts of references. Authors like Shakespeare and Pope have a couple of chunks, whereas authors like Cowley and Virgin have very concentrated areas.
Count of gesture types across texts
This chart is simply displaying the frequency of different types of references. It's clear that referencing the title of a work is the most popular reference type, with quotes being a close second. These works are not typically remixed, with only one remix existing in the whole database.
Line graph of number of references to women and number of texts written by women over time
These two charts explore the relationship between the number of references to female authors and the number of texts written by female authors in order to see if the rate of referencing female authors has increased over time. In the first chart, the orange line plots the number of texts written by female authors published on or before that year. The blue line plots the number of references to female authors in that year. The blue line is very choppy and goes up and down a lot, but there does seem to be an overall upward trend. In the second chart, the blue line plots the ratio of references to female authors vs the number of texts existing that are written by female authors. Looking at the ratio, it does not appear that there is a clear upward trend of the ratio. Certain later years do have a much larger prevalence of referencing female authors, but it is so choppy that it is hard to note an upward trend. I would have expected the referencing to female authors to be less variable and volatile.
Scatter Plots: which women are referencing iconic authors and when?
A series of scatter plots displaying how women have been referencing authors like Shakespeare, Pope, Horace, etc over the years. Each circle represents a text written by a woman, and the size of the circle relates to how many intertextual gestures they used. It is interactable, and more information can be accessed with a hover. Here, we identified that Barbauld had many references to herself; this would make sense as the published work is a collection of her other works. We can see that Shakespeare and Pope remain the most consistently referenced authors over the years.
Bar Graph: Which texts are women referencing the most?
A bar graph displaying how many women in the database have referenced each work. Shakespeare's Hamlet comes in at number one, with almost 30 women referencing it. This chart displays all the works that were referenced, and the extra data can be accessed with a scroll.
Sankey Diagrams
A series of Sankey Diagrams displaying when women were publishing. These Sankey diagrams show which female authors published works of writing in the 1600’s, 1700’s, and 1800’s with five or more works of writing in the database. As shown, it is evident that the number of female authors have increased every century because the graphs for the 1700’s and 1800’s have darker lines representing more works of writing. Even though the graph shows writers with most works in the database the number of female written texts increases substantially.
The goal of this project is to find any new insights to the Women’s Writer’s Project database of written works. Specifically, to find any outcomes that would get their readers more intrigued and informed. The visualizations are centered around women writers and who they are referencing in their own work. The visualizations addressed the task analysis questions proposed above. Overall, the data shows that the amount of women who published over time increased significantly. With that the number of references also increased however not nearly as much as women writers. In the scatter plots, it is evident that Shakespeare and Pope are regularly referenced by female writers. Barbauld, who is a woman, has a large amount of references to herself that stem from a collection of her published works. In all, the data shows that women in the 16th, 17th, and 18th century consistently referenced other authors in their written works and that most of this time they referenced other male writers. Women in the writing and publishing world have come very far since the 16th century. To further our findings, it would be interesting to see if the number of women who referenced women has increased since the 19th century.